
The notion of “eyes on the street” generally assumes that the more people there are on a street the less opportunity there is for crime to occur. Therefore, one of the easiest ways to deter a significant amount of crime is to have a constant presence of people acting as a sort of surveillance for the neighborhood. This is accomplished by having a mix of commercial and residential uses on a street, thus promoting a street ballet at all hours of the day and night. As Jane Jacobs wrote in her seminal book The Death and Life of Great American Cities:
“There must be eyes upon the street, eyes belonging to those we might call the natural proprietors of the street. The buildings on a street equipped to handle strangers and to insure the safety of both residents and strangers, must be oriented to the street. They cannot turn their backs or blank sides on it and leave it blind. And third, the sidewalk must have users on it fairly continuously, both to add to the number of effective eyes on the street and to induce the people in buildings along the street to watch the sidewalks in sufficient numbers. Nobody enjoys sitting on a stoop or looking out a window at an empty street. Almost nobody does such a thing. Large numbers of people entertain themselves, off and on, by watching street activity.”
The idea of eyes on the street makes sense to the typical urbanist, and it seems reasonable to assume it is a valid and effective theory. However, there have not been many substantial studies done on the subject. In this post, I am looking at the relationship between the density of the residential built environment (housing units per acre) and rates of crime in Chicago community areas. There are of course other variables that affect eyes on the street, such as land use, vacancy, tourist attractions, etc. but they will not be covered in this post. And, as a disclaimer, crime of course cannot simply be generalized; there are multiple complex reasons for why crime occurs and where. There are many deep rooted systematic problems that affect crime and it is a subject that is incredibly complicated and nuanced. In this post I am simply interested to see if there is any correlation that can be drawn between data on the density of the built environment and crime in Chicago.
One issue that seems to be occurring with regularity is that when home values reach a high point and people start deconverting multi-family homes to single family ones, neighborhoods become more homogeneous and lose density. This can be a problem because, in some cases, very wealthy people may have multiple homes and thus do not live in any of them full time and homes that are vacant for any significant length of time begin to turn streets into deserted blocks with little street life. I have seen this happen on the North Side in Ravenswood for example, where occasionally someone will tear down an entire house next door to transform the lot into their private yard. Instead of creating higher density and encouraging more people to live in an area, the opposite occurs. In desirable neighborhoods, it seems to me, this is happening at a high rate. But, does loss in density have any correlation with increase in crime?
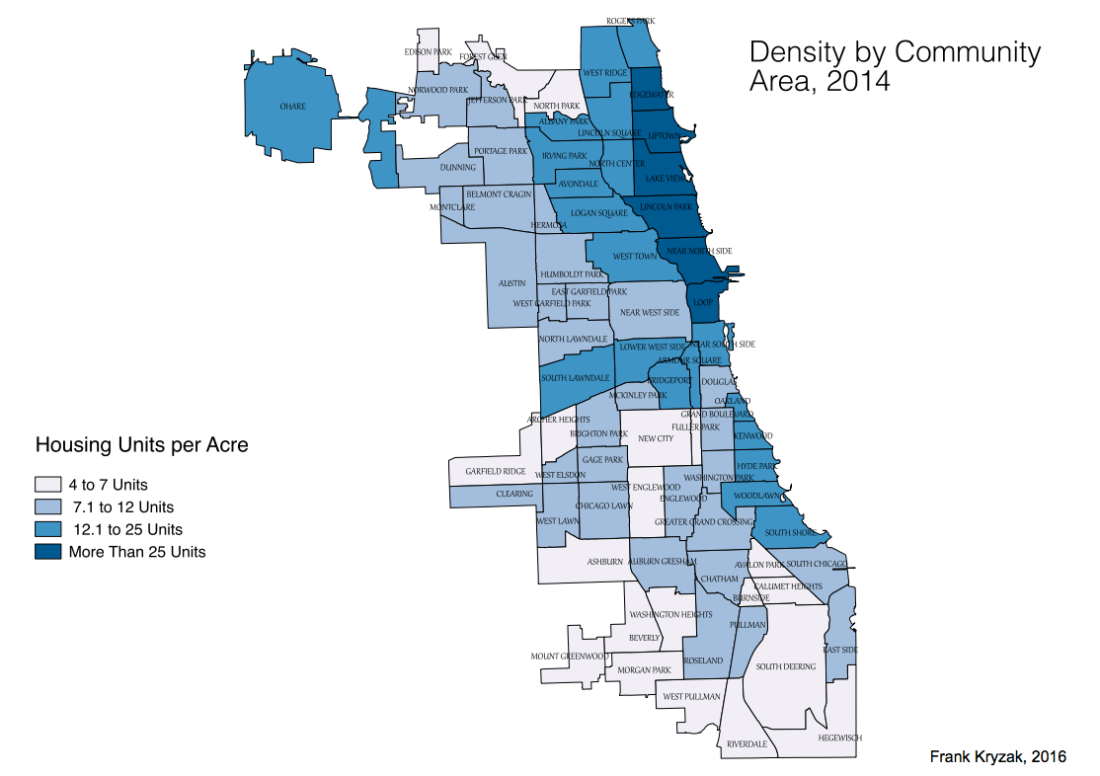
As a starting point, see the below map for a general idea of density levels throughout Chicago. The map is divided by census tract (using the US Decennial Census and the US Census ACS 5 Year Estimates (2010-2014)) and based on housing units per acre rather than the more traditional people per square mile.

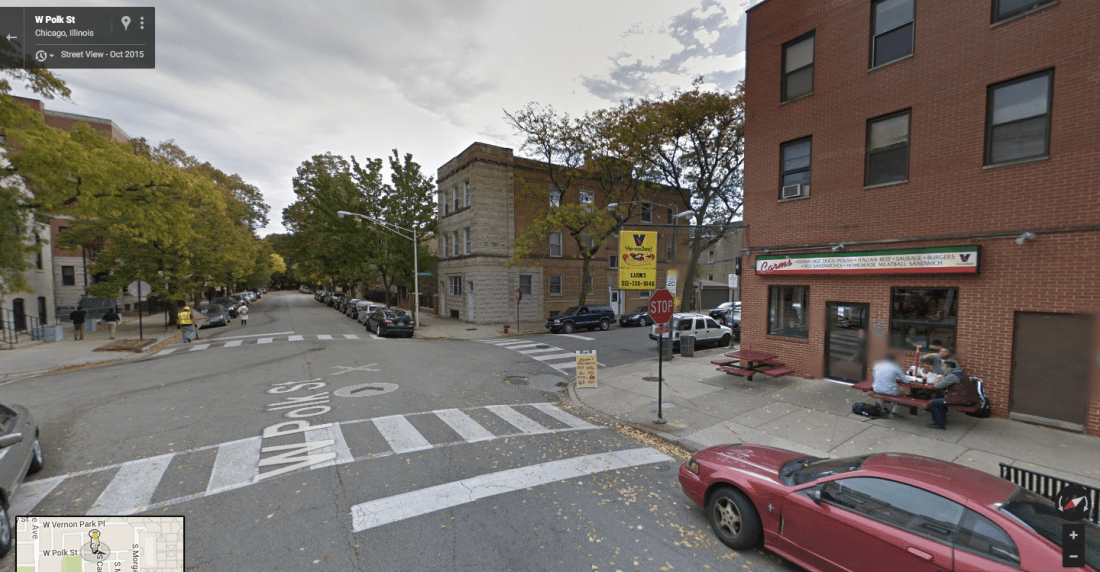
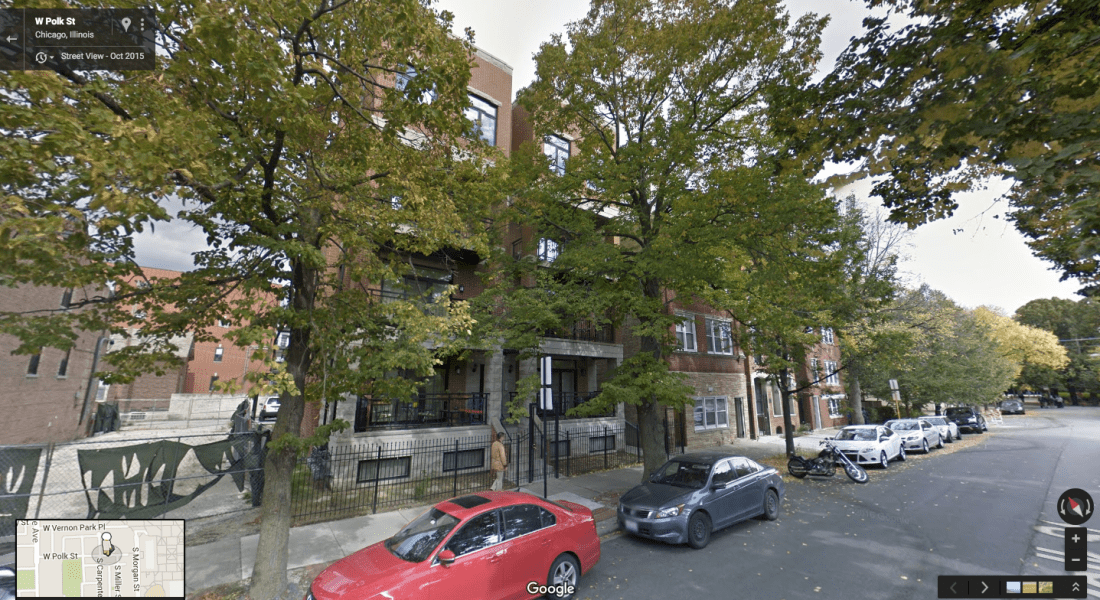
To look at the relationship between the eyes on the street theory and density, I analyzed Little Italy/University Village, a neighborhood I had spent years living in, because I feel it is a good representation of the basic tenants that Jane Jacobs wrote about. While this neighborhood has lost people over time, in many cases due to students and professors replacing larger families, the number of housing units hasn’t decreased and there is a fairly constant presence of street life at different times of the day and night. Let’s use the Polk and Carpenter intersection as an example.
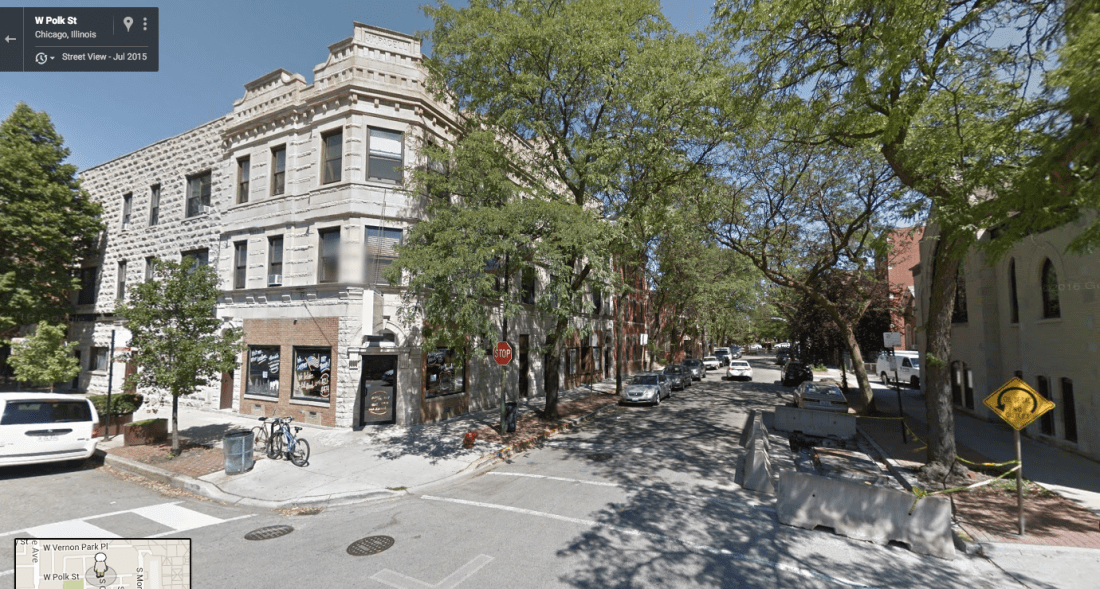
People sit outside at Carm’s, and on the sidewalk outside of their buildings in lawn chairs when the weather is favorable. Those who own and work at Fontano’s still live on the block. There are eyes on the street, and there is a mix of uses in a residential area. This sort of mixed use is not generally supported by current zoning in residential areas.
But, is there any evidence to support the idea that this type of density and mixed use that creates eyes on the street in Little Italy/University Village can actually help curb crime?

Anecdotally, I know of someone who was robbed on Taylor Street a few years ago around 2:00 am. A resident in a nearby apartment building witnessed the crime and called the police who then found the perpetrator and recovered and returned the stolen items to the victim. Just for purposes of discussion, if that apartment building were not facing the street with no setback, or if it weren’t an apartment building at all, then perhaps no one would have heard or seen the crime, or if it were a single family home perhaps everyone would have been asleep. Of course, this is purely hypothetical, but I truly believe that no one would have seen the crime if the built environment was of a less urban, dense, mixed use character. Then again, maybe the perpetrator wouldn’t have even been looking to rob someone if it was a residential only street. Such hypotheticals are part of the problem with the lack of studies on the efficacy of the eyes on the street theory.

The following maps use data from the US Decennial Census, the US Census ACS 5 Year Estimates (2010-2014), and the The Chicago Tribune (The 2001 crime statistics from the Chicago Tribune run from February 2001 to January 2002, the January 2001 data were not available). The Chicago Tribune data defines violent crime as consisting of assault, robbery, battery, sexual assault, or homicide. The Chicago Tribune defines property crime as consisting of arson, theft, burglary, or motor vehicle theft.
Below I will consider correlations first between density and crime rates and then between changes in density and changes in crime rates over time.
Comparing Density and Crime Rates
The following maps compare the density of each community area in Chicago and the annual violent and property crime rates for each community area.


Interestingly, there seems to be a general pattern in which the community areas with the highest densities have some of the lowest violent crime rates when looking at the chart below. However, there are community areas sprinkled throughout the density spectrum that also have low violent crime rates, especially toward the lower density community areas. This may suggest that, perhaps, a really high density or really low density built environment may have some sort of correlation with lower violent crime rates.
The following chart shows density, property, and violent crime for all 77 community areas. A higher resolution chart can be found here.
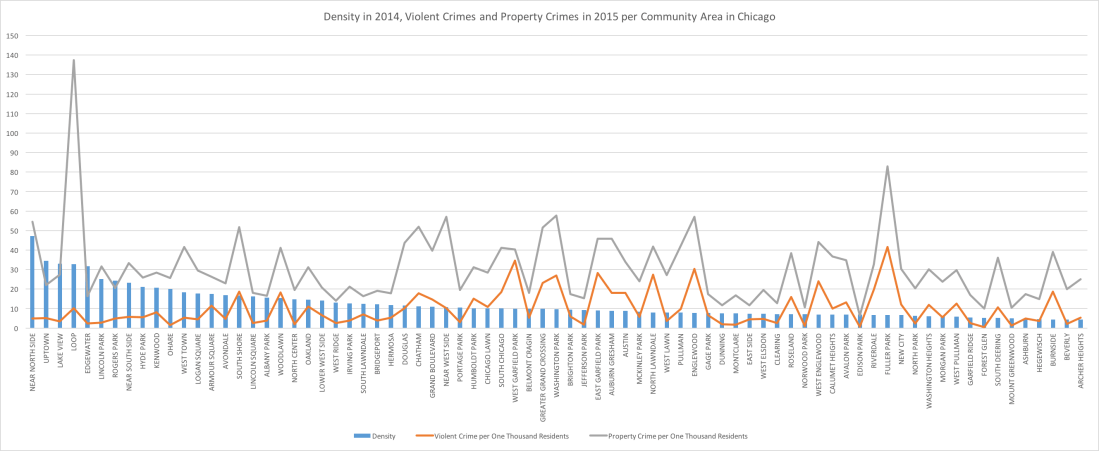
The correlation coefficient for density and violent crime rate per thousand people is -0.2 which is weak. The correlation coefficient for density and property crime rate per thousand people is 0.37 which is also weak. Interestingly, the correlation, although weak, is positive for density and property crime, which would suggest that there is a weak correlation between higher density and higher property crime (when simply looking at the chart, though, it is clear that this may be skewed because of the outlier that is the Loop).
There is a greater concentration of high peaks for property crime in the middle of the density spectrum, with some more towards the bottom of the community areas in terms of density. The Loop is an outlier. As noted above this could be for any number of reasons, such as the high number of tourist attractions, etc. The same pattern appears for violent crime, with a concentration of peaks in the middle and near the bottom of the density spectrum. Generally speaking, many of the community areas that have a higher peak in one type of crime also have a higher peak in the other, and even though a number of community areas have very similar density, the amount of crime in many cases is not correspondingly similar.
Comparing Changes in Density and Changes in Crime Rates
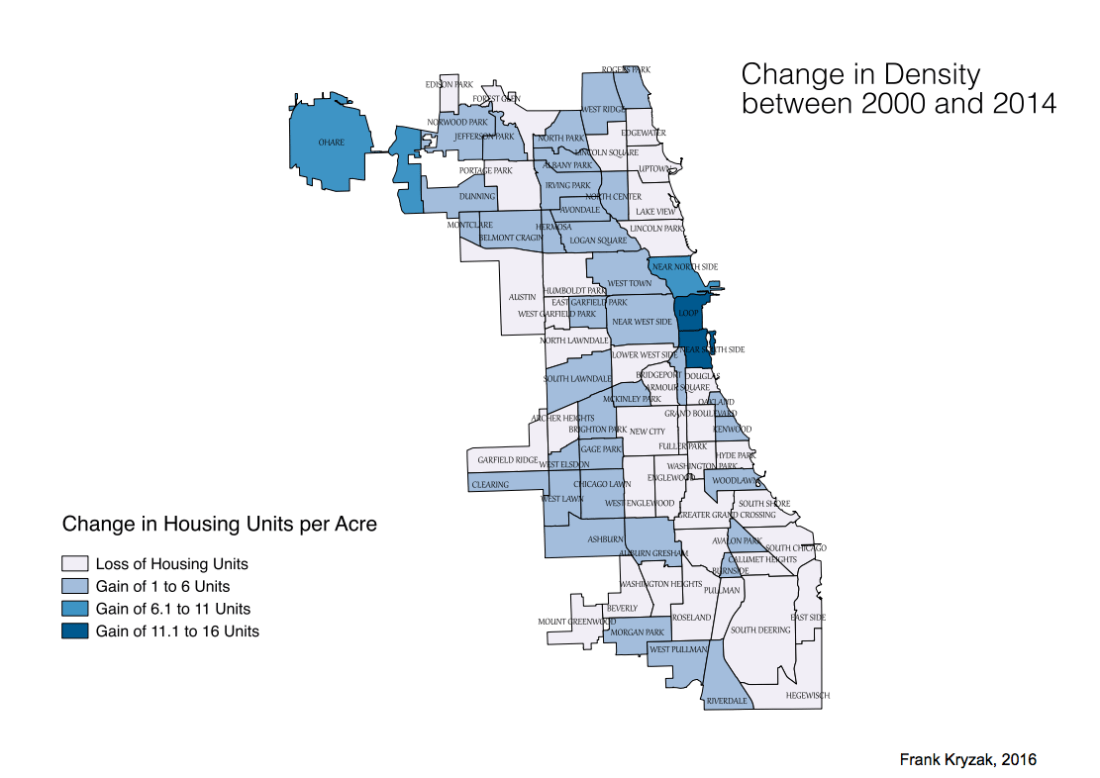
The following maps show the change in density per community area, the change in violent crime per community area, and the change in property crime per community area.
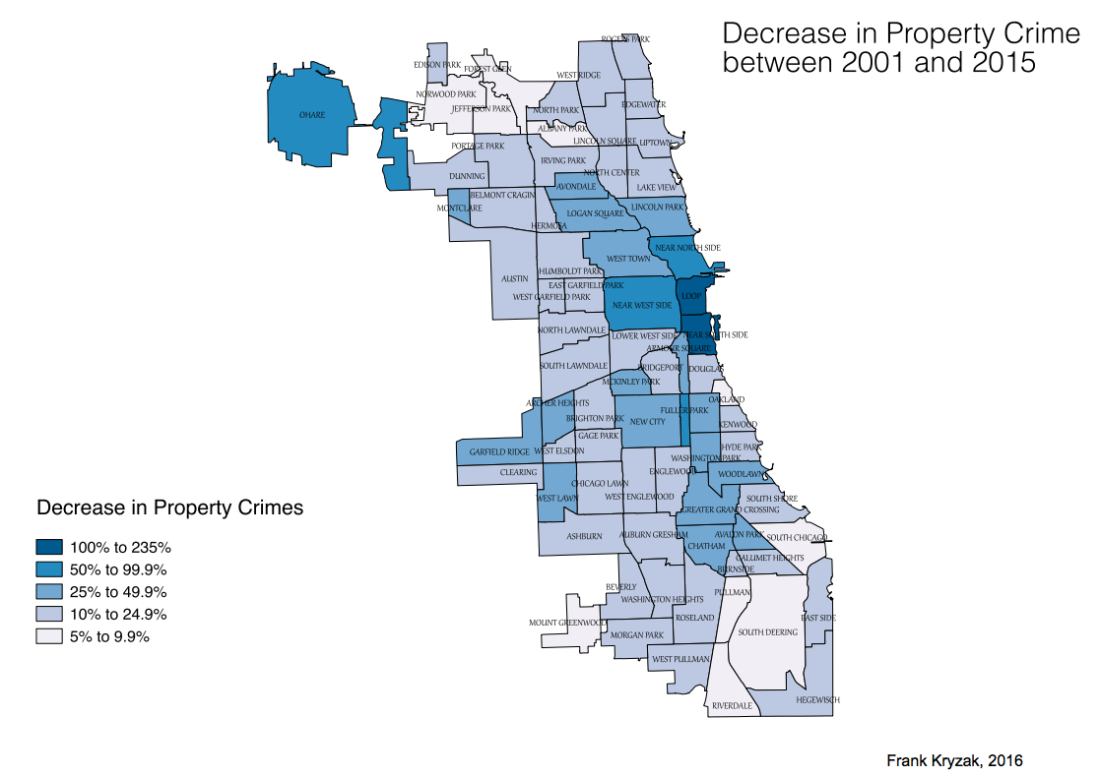

Interestingly, some of the communities, for example Washington Park, had a larger decrease in violent crime yet still have an incredibly high violent crime rate relative to other community areas (for example, Washington Park saw 56.69 violent crimes per 1,000 residents in 2001 and 26.95 violent crimes per 1,000 residents in 2015; that is a 52% drop in violent crime, which was higher than most other community areas, but still has the 7th highest violent crime rate in 2015).
The following chart shows the change in density and property and violent crime for all 77 community areas. A higher resolution chart can be found here. Note: the y-axis (vertical) for property and violent crime data points represents percentage drop in crime, for example the Near South Side had an 80% drop in violent crime and a 75% drop in property crime. This means the higher a peak is on the y-axis the higher the decrease in crime.
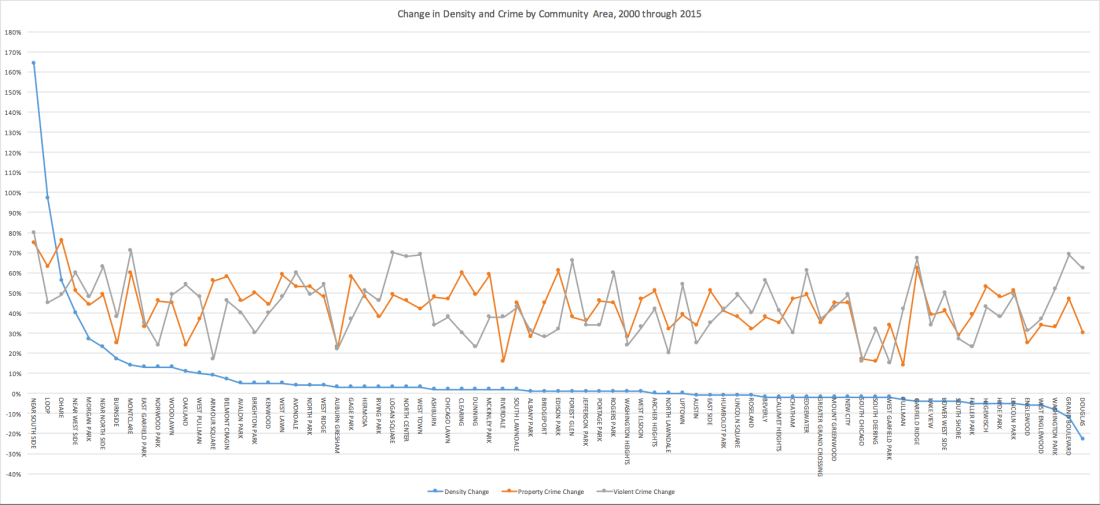
The correlation coefficient for change in density and change in violent crime is -0.29, which is a weak correlation. The correlation coefficient for change in density and property crime is -0.45, which is a higher negative correlation but is still weak. For example, if the correlation coefficient were -1, that would mean there would be a strong correlation between, say, loss in density and rise in crime. These two charts show that changes in density and crime essentially have no correlation.
After determining that there is weak correlation between changes in density and changes in crime when considering all 77 community areas, I was curious to look at a smaller sample of community areas that stood out (for example, the communities with the smallest and largest change in violent crime). I also added changes in household median income to see if any patterns might be revealed regarding why there may have been a large or small change in crime. The following table shows community areas with the smallest drop off in violent crime and corresponding change in density and change in household median income (source: US Census ACS 5 Year Estimates 2009-2013):
| Community Area | Change in Violent Crime | Change in Density | HH Median Income 2000 | HH Median Income 2013 |
| West Garfield Park | -15% | -2% | $31,278.74 | $25,133 |
| South Chicago | -16% | -2% | $38,256.63 | $29,748 |
| Armour Square | -17% | 9% | $30,784.96 | $24,101 |
| North Lawndale | -20% | 0% | $43,723.40 | $23,066 |
| Auburn Gresham | -22% | 3% | $46,318.13 | $29,167 |
| Dunning | -23% | 2% | $66,785.07 | $60,370 |
| Fuller Park | -23% | -5% | $24,908.27 | $16,966 |
Interestingly, while all of the community areas with the smallest drop in violent crime had a wide variance in density change, all of them had a drop in household median income of at least $6,000.
Conversely, this table shows community areas with the largest drop in violent crime and corresponding change in density and household median income (source: US Census ACS 5 Year Estimates 2009-2013):
| Community Area | Change in Violent Crime | Change in Density | HH Median Income 2000 | HH Median Income 2013 |
| Near South Side | -80% | 164% | $46,441.24 | $73,763 |
| Montclare | -71% | 14% | $63,090.49 | $43,739 |
| Logan Square | -70% | 3% | $49,033.25 | $53,149 |
| West Town | -69% | 3% | $52,645.31 | $69,640 |
| Grand Boulevard | -69% | -12% | $19,180.40 | $30,523 |
| North Center | -68% | 3% | $70,019.68 | $87,889 |
| Garfield Ridge | -67% | -4% | $61,467.10 | $62,947 |
The Near South Side had the largest drop in violent crime and also the highest jump in density. Grand Boulevard on the other hand had the second largest decrease in density of all the community areas yet still had the fourth largest loss in violent crime. There was an increase in household income for all of the community areas with high loss in violent crime, except for Montclare. Interestingly, in Montclare density increased at a much higher rate than many other community areas but the median income not only decreased but decreased by a very large number.
This table shows community areas with the largest drop in property crime and corresponding change in density and household median income (source: US Census ACS 5 Year Estimates 2009-2013):
| Community Area | Change in Property Crime | Change in Density | HH Median Income 2000 | HH Median Income 2013 |
| O’Hare | -76% | 56% | $58,904.84 | $44,300 |
| Near South Side | -75% | 164% | $46,441.24 | $73,763 |
| Loop | -63% | 97% | $88,106.99 | $86,314 |
| Garfield Ridge | -62% | -4% | $61,467.10 | $62,947 |
| Edison Park | -61% | 1% | $77,223.49 | $80,230 |
| Clearing | -60% | 2% | $61,598.32 | $61,598 |
| Montclare | -60% | 14% | $63,090.49 | $43,739 |
The top three community areas in terms of decrease in property crime all had incredibly high increases in density. However, the other four community areas with the highest change in property crime did not have nearly as much of an increase in density and in the case of Garfield Ridge, actually lost density. There is also a very high variance in change in household income for these community areas.
This table shows community areas with the smallest drop in property crime and corresponding change in density and household median income (source: US Census ACS 5 Year Estimates 2009-2013):
| Community Area | Change in Property Crime | Change in Density | HH Median Income 2000 | HH Median Income 2013 |
| Pullman | -14% | -3% | $41,891.68 | $40,818 |
| Riverdale | -16% | 2% | $17,827.57 | $14,008 |
| South Deering | -16% | -2% | $47,063.54 | $31,482 |
| South Chicago | -17% | -2% | $38,256.63 | $29,748 |
| Auburn Gresham | -23% | 3% | $46,318.13 | $29,167 |
| Oakland | -24% | 11% | $14,528.02 | $21,306 |
These community areas also had variance in density change, although not a very high variance other than Oakland, which had a fairly high increase in density at 11%. All of these community areas lost household median income except for Oakland, but the amount of income change varies pretty significantly.
What Does All of This Mean for the Relationship Between Density and Crime?
I must admit, when I began this analysis I was not expecting to see results indicating there is weak correlation between density and crime rates in Chicago. Certainly, the notion of eyes on the street is a valuable planning theory. While the correlation between density and crime did not support this theory as strongly as I expected, this is not necessarily surprising considering the myriad of other factors that affect eyes on the street, which are beyond the purview of this analysis. Further, the theory of eyes on the street was developed by Jane Jacobs’ observations of a specific location during a specific time. Many things have changed since the theory was developed in the 1960s and each place is unique. It can be misleading to take ideas from a certain place and time and assume they will be universally applicable.
Perhaps, I will look at eyes on the street through the lens of land use in the future, because looking at density (in units per acre) may not be the best indication of how many eyes are on the street. It is also important to take in to account the type of density as well. A very dense tower that sits alone in a sea of parking or a large park will not have the same eyes on the street as a row of three-flats that bump up directly to the street. Unfortunately such considerations are not possible when simply using census data and would require additional field research. It is also possible that doing the same analysis but using density in terms of people per square mile would reveal different correlations. At this point, however, the conclusion I draw from looking at communities in Chicago, is that the density of the built environment has less to do with crime than I originally assumed.
Image at top from yochicago, all other images from Google, all maps by Frank Kryzak.
