If you have ever been to a community meeting you likely know the word density can be very scary to many people. Density is associated with congestion and parking issues. The word causes images of a high rises and “other” people who are not really “part of the community” to pop into the heads of those who live in the neighborhood. These negative associations, while common, do not do justice to what density signifies. What are we really talking about when we talk about density? The most ubiquitous method of calculating density is in terms of people per square mile. This is a fair and sensible way of looking at density but it does not necessarily tell the whole story of the built environment. This is particularly important because urban designers and planners often think of density in terms of residential units per acre rather than people per mile. While density doesn’t necessarily tell a comprehensive picture of the built environment in any particular place, it is helpful to look at density in multiple ways. Thus, after scouring the internet and finding nothing, I decided to create a density map of Chicago in terms of residential units per acre.
Density as measured by people per square mile is interesting and it is certainly important to know how many people live in a particular area. However, if you simply look at a residential density map of a city it could be misleading. People often have certain perceptions of the city in terms of the built environment, not necessarily with how many people actually live in a particular area. In some cases, there is a large discrepancy in census tracts between the density of people per square mile and units per acre. For example, an area with single family homes might have a fairly high density of people per square mile but low units per acre. Conversely, an area with large apartment or condominium buildings with only 1 or 2 people living in each unit might have a lower density of people but a much higher density of units per acre.
To create a map of units per acre in Chicago, I took the number of housing units for each census tract from the 2014 American Community Survey 5 year estimates. I then measured each census tract using Google Earth (as an important note, I only included developable land in the measurements, for example I excluded highways and water). Once I had the measurements, I divided the number of units by the land area in acres.
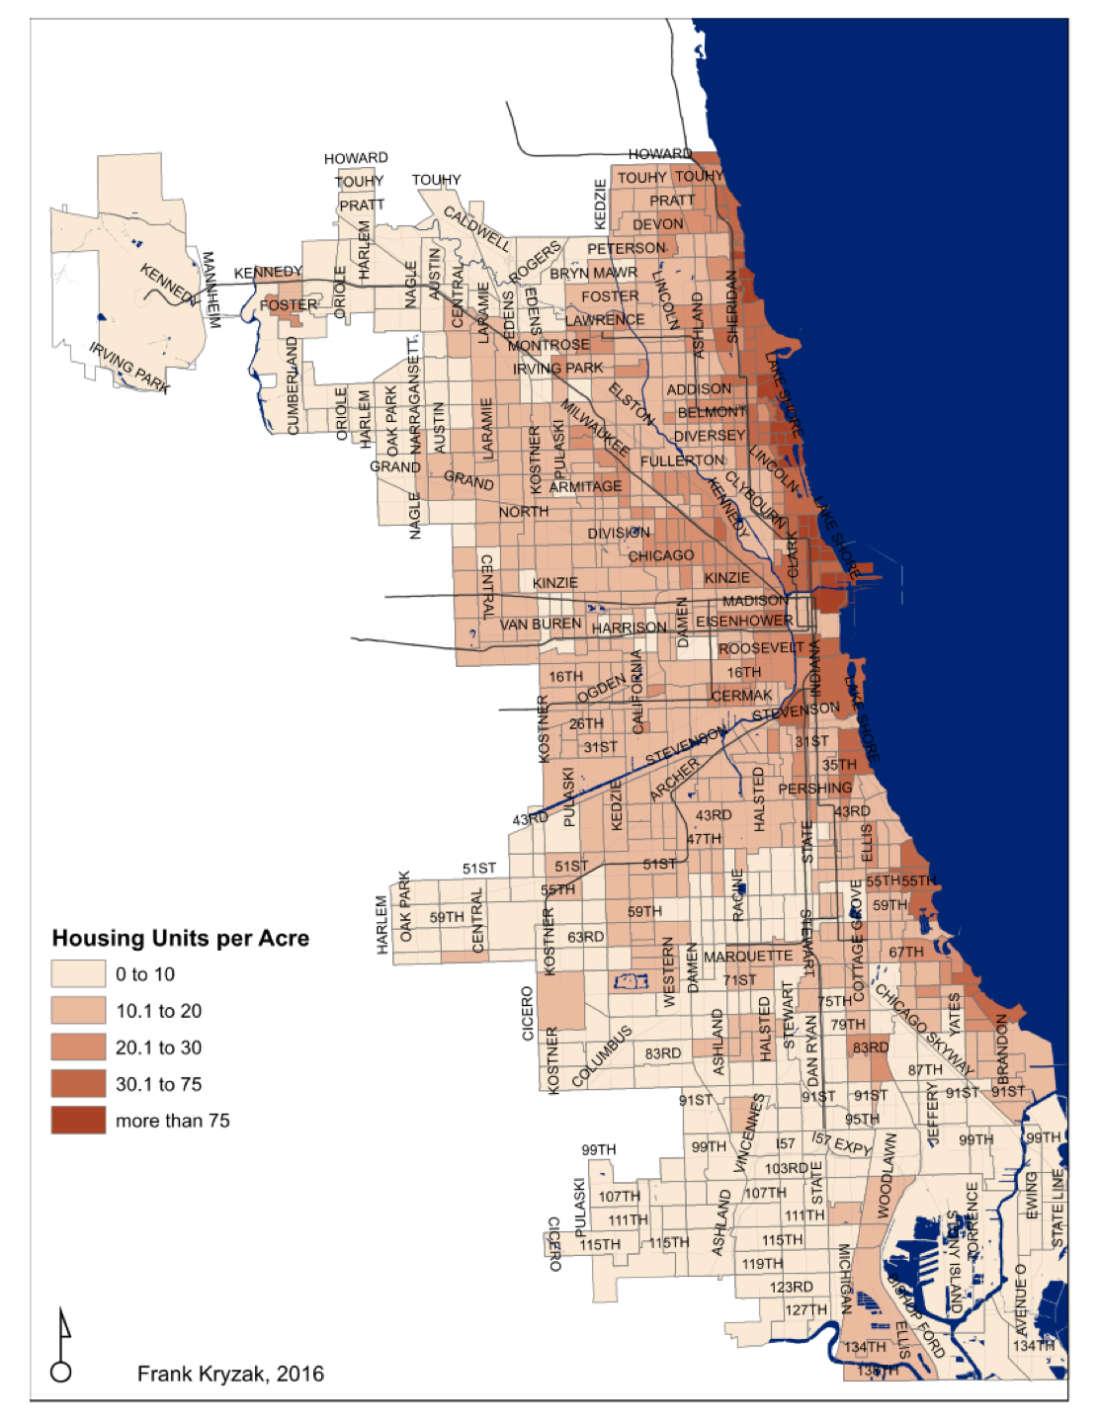
The following is a map of units per acre for all of the census tracts in Chicago broken into five ranges with CTA rail lines overlaid on the tracts:

When density is broken into three categories rather than five, the discrepancies in density in the city become much clearer. Essentially, the following map shows that the not-so-dense parts of Chicago make up the majority of the city while the dense parts make up the bulk of the North Side, including: neighborhoods along the Milwaukee Avenue corridor such as River West, Ukrainian Village, Wicker Park, Logan Square, Bucktown, and Avondale; Bridgeport; the South Loop; select neighborhoods along the south shoreline; Pilsen, Little Italy, and other neighborhoods that follow the Pink Line such as Little Village; and a small number of scattered census tracts throughout the city. These findings tend to correlate with popular perceptions of Chicago. The extremely dense parts of Chicago are along the north part of the lake shore and three census tracts along the southern lake front.

The following maps are the same as the previous two but with major street names included for reference.

Additionally, density can mean different things even if the numbers are the same. Take census tracts 502 and 3504 into account. Tract 502, located in North Center, has 17.4 units per acre which is nearly the same as Tract 3504, located in Bronzeville, which has 17.1 units per acre. Even though the densities are the same, the built environment is very different; the North Center Tract is more walkable, has more mixed-use buildings with commercial components on the first floor, and a consistent street wall. The census tract in Bronzeville has a built environment that is reminiscent of Le Corbusier’s Radiant City and the “towers in the park” theory.


Now, let’s look at an aerial view of the Bronzeville and North Center tracts. Even though the density is nearly the same, it is evident that the settlement of the land use is much different. The Bronzeville census tract is not nearly as walkable – which is to say that while it may be nice to walk around in, certainly in the summer, everything is more spread out and there is little to no mix of uses, certainly no commercial activity integrated with housing. The tract in North Center, even on the residential-only streets, has buildings that bump up closely to the street and sidewalks with very little space dedicated to cars. The Bronzeville tract ends up being more automobile-centric because, other than playing at the park or going to and from one of the towers, residents have to drive a car or walk a long distance to do anything else; it is almost like a city unto itself, but with little more than housing.


The following images are examples of the different categories of densities that the previous density map shows. These images make it easier to visualize what the different categories of density really look like. To some the variety in housing settlement patterns in Chicago may come as a surprise. For instance, census tracts 1005, 1701, and 6505 have low density and look and feel incredibly suburban. As you can see in the map below, these three census tracts are at the edge of the city.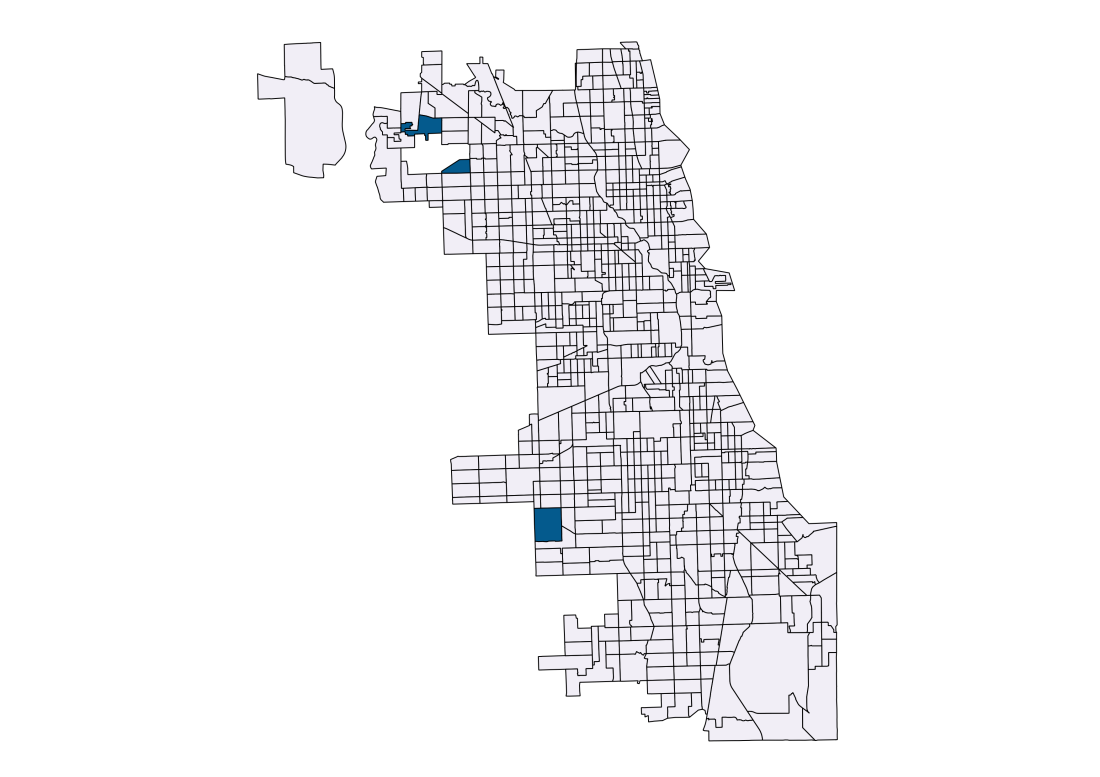
Tract 1005, Oriole & Foster- 5.3 units/acre:

Tract 1701, Bittersweet Place- 7.6 units/acre:

Tract 6505, Tripp & 68th- 10.2 units/acre:

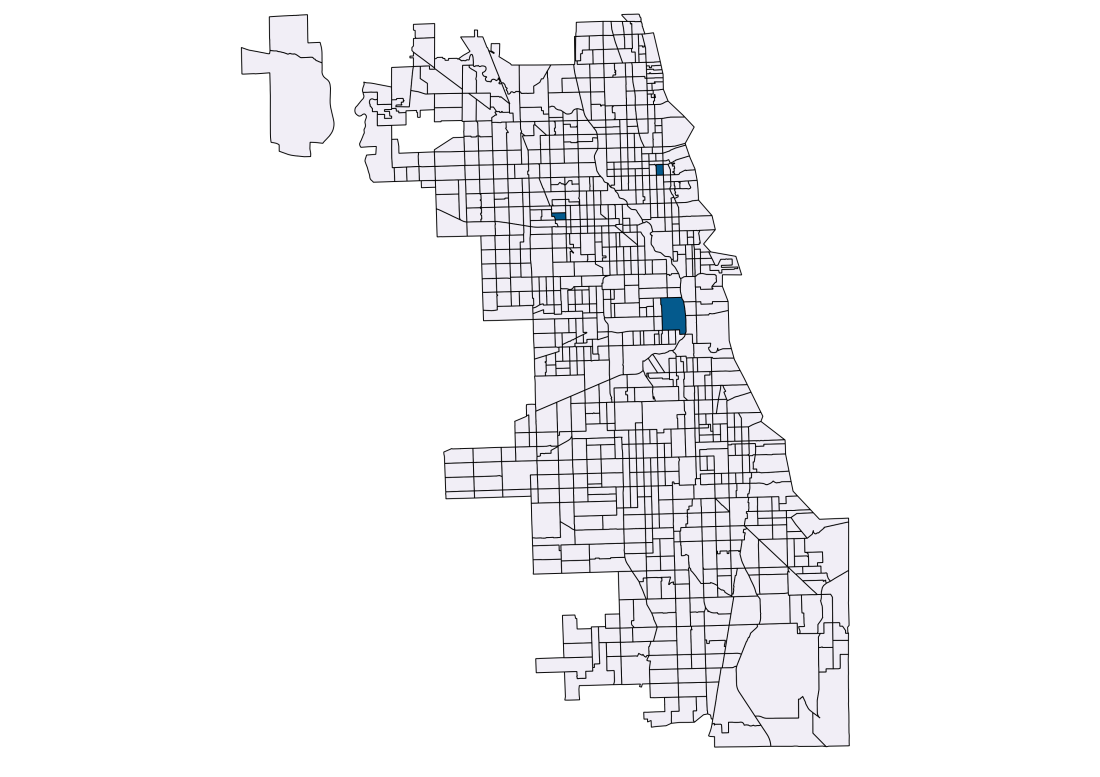
The next examples of density ranging from 20 to 35 units per acre are located in Logan Square, Lakeview, and University Village- all much closer to the city center than the previous tracts.
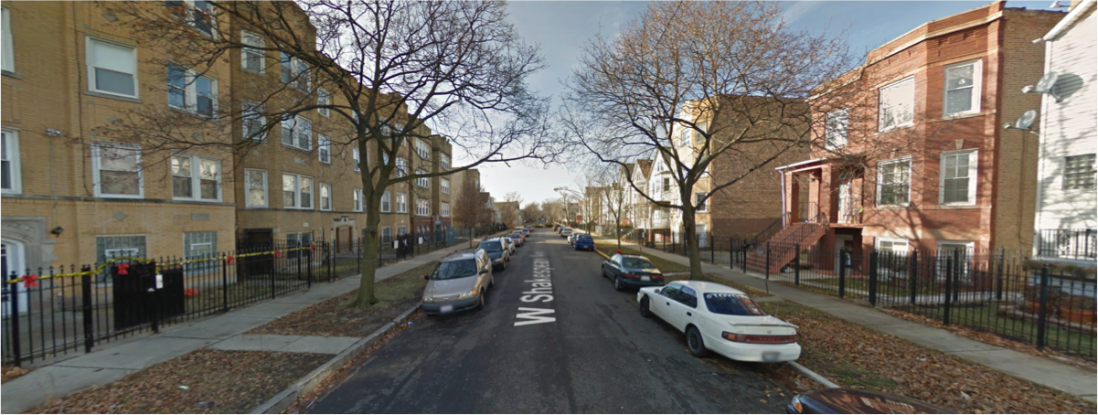
Tract 2209.01, Shakespeare & Central Park- 20.0 units/acre:
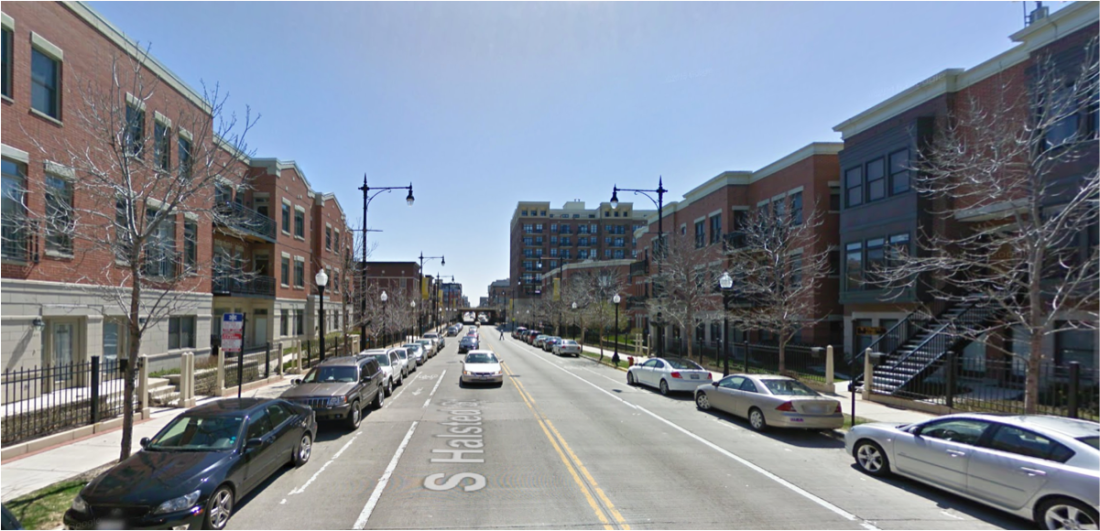
Tract 8419, Halsted & 14th- 27.6 units/acre:
Tract 621, Clark & School- 32.7 units/acre:

And finally, the next examples are of density ranging from 65 to over 130 units per acre. The census tracts are located in East Lakeview, the north portion of the lakeshore, and River North in the city center.

Tract 715, Lincoln & Lincoln Park West- 68.3 units/acre:

Tracts 633.01/633.02, Pine Grove -85.8/101.7 units/acre

Tract 811, Dearborn & Elm- 132.6 units/acre:

The following example shows why it is beneficial to look at density in multiple ways, including residential units per acre. Census tract 3301 in the South Loop has 48.3 units per acre, which is quite dense, but it only has 16,298 people per square mile. When you look at a typical density map and see that census tract 3301 has just over 16,000 people per square mile, it is likely that you don’t envision the built environment looking like this…
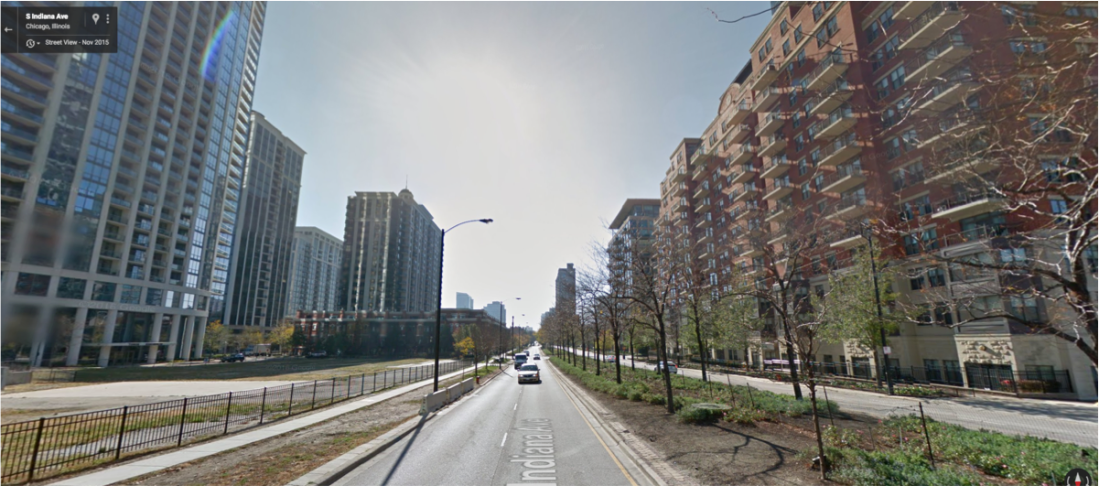
Now, if we consider census tract 1904.01, it has a population density of 16,528 people per square mile, a nearly identical population density of people per square mile as the South Loop census tract above. However, the density of housing units per acre is only 9.5! That is nearly 40 units per acre less than the South Loop census tract, and this is what tract 1904.01 looks like…

Density can be a polarizing topic but I believe it is important to look at it in many different ways to get a more fully realized picture of exactly what it is we are addressing when we discuss density. The difference in the built environment between the two tracts discussed immediately above, which have nearly identical people per acre density, is a perfect example of why multiple approaches are necessary. The units per acre maps that I have created are meant to make the conversation around density in Chicago more robust and informed. This certainly will not be the last post regarding this topic, as there will be following posts looking at density and its relationship with transit and crime, and surely additional posts in the future. This post is simply meant to jump start the conversation and to take an inventory of what the built environment looks like in Chicago while illuminating some of the different ways density can be considered.
Photo at top from shayhata.com, all other photos from Google.

Great post, very interesting!
LikeLike
Awesome post. Would love to see some similar analysis of other cities. Baltimore and maybe Miami would be interesting.
LikeLike
Please keep writing posts like this! I am a longtime Chicagoan and spent many years living in the South Loop and Hyde Park. great post–looking forward to more of your writing!
LikeLike
Thanks for doing this work! I’m a pastor in Chicago, at a church (Park Community Church) that maintains a strong neighborhood focus. This post will help me approach my area (the Far Northwest Side) n a more informed way. Thanks again.
LikeLike
This is great research, and very helpful for thinking about the urban environment of Chicago. Good job, and thanks for your contributions to the intellectual landscape of the city!
LikeLike
Hi – very interesting post. Do you happen to have density data for specific zip codes in Chicago that you can share?
LikeLike